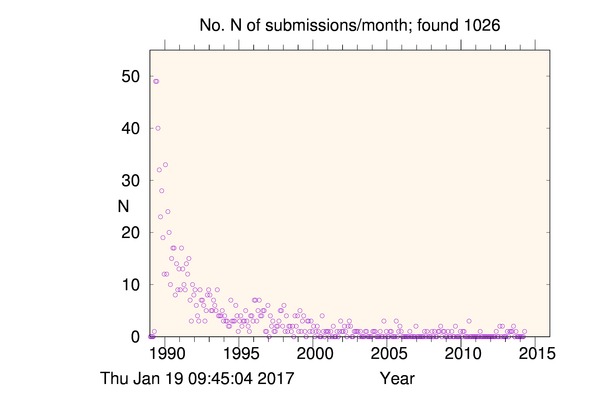
Submissions per month

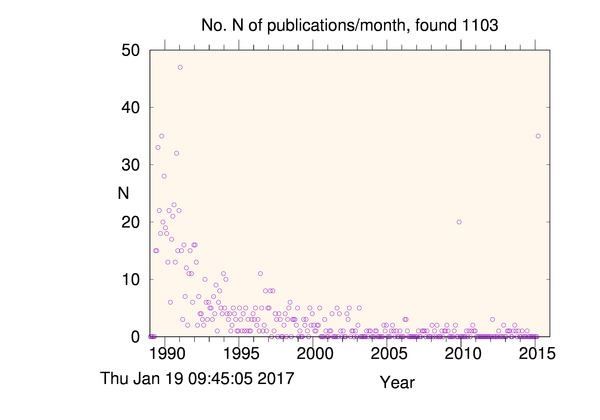
Publications per month

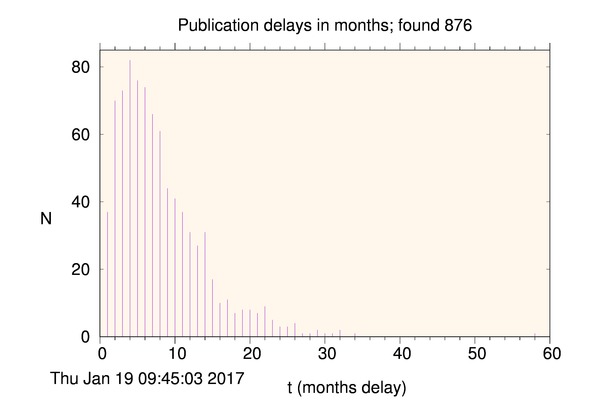
Histogram of publication delays

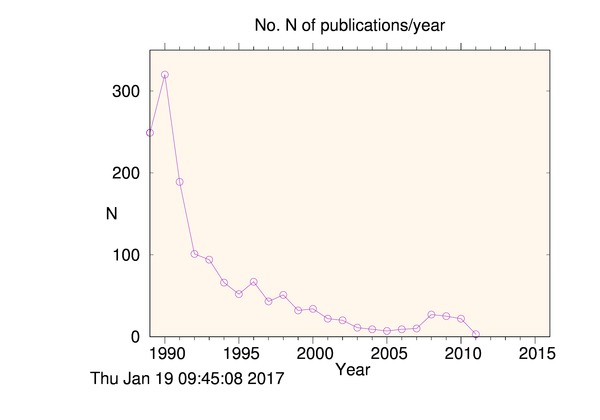
Publications per year

Below are the plots of submission and publication rate (papers/month) of cold fusion papers against the year of submission and publication, for as many entries as I could find the dates for (shown in the plot titles). Also, there is a plot of publication delays, that is, the number of months between submission and publication. Not all journals provide both dates, so the numbers are smaller than the total number of entries. Lastly, a plot of publications per year is shown. This is essentially a smoothed version of the monthly plot.


