Subpage of ICCF-21/Videos
Video from YouTube, transcript edited by Abd from YouTube closed caption. Slides from this PDF. Abstract from pre-conference distribution:
Nanosecond Pulse Stimulation in the Ni-H2 System
#Francis Tanzella1, Robert Godes2, Robert George2
1SRI International, United States
2Brillouin Energy Corp., United States
Email: francis.tanzella@sri.com [see Slide17 for new email]
[spacer height=”10px”]
Brillouin Energy and SRI International (SRI) have been performing calorimetry measurements on the Ni/ceramic/Cu coatings in a H2 atmosphere with nanosecond pulses applied between the Ni and Cu. The reactive cores have been described earlier [1]. We have been testing new materials, material fabrication techniques, and electrical stimulation methods to produce power and energy output in excess of that reported earlier. In addition to the pure metals, we have investigated systems using Ni-Pd coatings.
By applying fast pulses [2] of several hundred volts and tens of nanoseconds long, the current follows the “skin-effect” principle and is concentrated at the Ni-ceramic interface but returns through the bulk of the Cu. Two stimulation methods were used – steady-state and dynamic. In the steady-state method, the pulse power is measured directly using fast oscilloscopes that record the voltage across the core and a shunt resistor in series with the core. The input pulse power is determined by multiplying the calculated root-mean-square voltage and current and recorded every 10 seconds. Figure 1 shows typical waveforms collected from the oscilloscope and the calculated pulse power.
Using a sophisticated model of the calorimeter with up to 15 coefficients, the power reaching the five temperature sensors is determined during simultaneous continuous ramps of both heater and pulse powers. The power emanating from the core is determined during sequences of more frequent low voltage pulses (LVP) and compared to that found using less frequent high voltage pulses (HVP). The power determined during the more frequent LVP is set as the input power during that sequence. The power of the stimulation pulses during the less frequent HVP sequences is maintained equal to that during the more frequent LVP. Then the power calculated from the core is divided by that calculated during the reference sequences, giving a so-called coefficient of performance (COP). Table 1 below presents some of the recent results obtained using this dynamic stimulation method. Because the analytical method used for the dynamic stimulation is different from that used earlier with steady-state stimulation, a correction was applied for better comparison. The corrected results are presented in the last column in the table. The actual excess powers in the first column are up to three times greater than those measured earlier.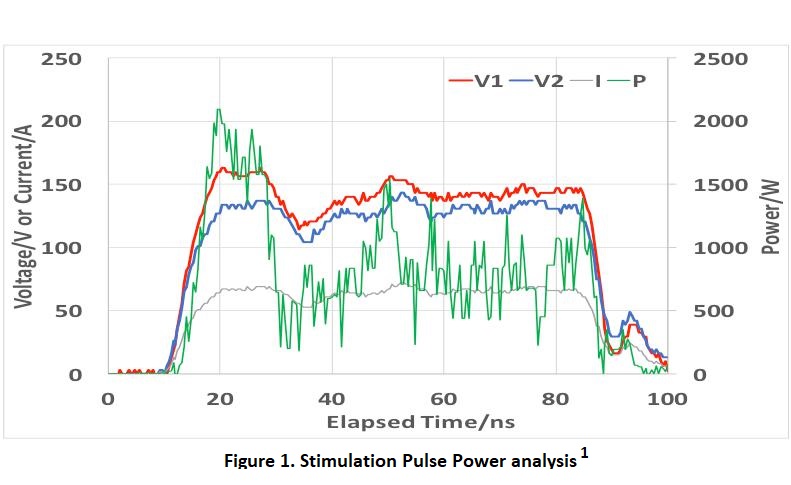
| QREACTION Watts |
COP / using DS method | COP / using legacy method |
| 3.62 | 1.25 | 1.56 |
| 3.59 | 1.26 | 1.55 |
| 3.90 | 1.27 | 1.62 |
| 4.91 | 1.31 | 1.56 |
| 4.99 | 1.31 | 1.58 |
| 4.85 | 1.31 | 1.58 |
[1] F. Tanzella, R. Godes R., et al. “Controlled electron capture: enhanced stimulation and
calorimetry methods”, J. Condensed Matter Nucl. Sci., vol. 24, pp. 301-311, 2017.
[2] R. Godes, “Drive circuit and method for semiconductor devices”, US Patent 8,624,636, 2014
00:00 good morning! happy to see all 00:03 these nice friendly faces, 8 o’clock in 00:06 the morning.
Slide1
[all the original slides are “© 2018 SRI International”]
anyway 00:10 today I’m here to give you an update on 00:13 what we’ve been doing at SRI, relative 00:16 to Brillouin Energy experiments, since 00:18 ICCF-20.
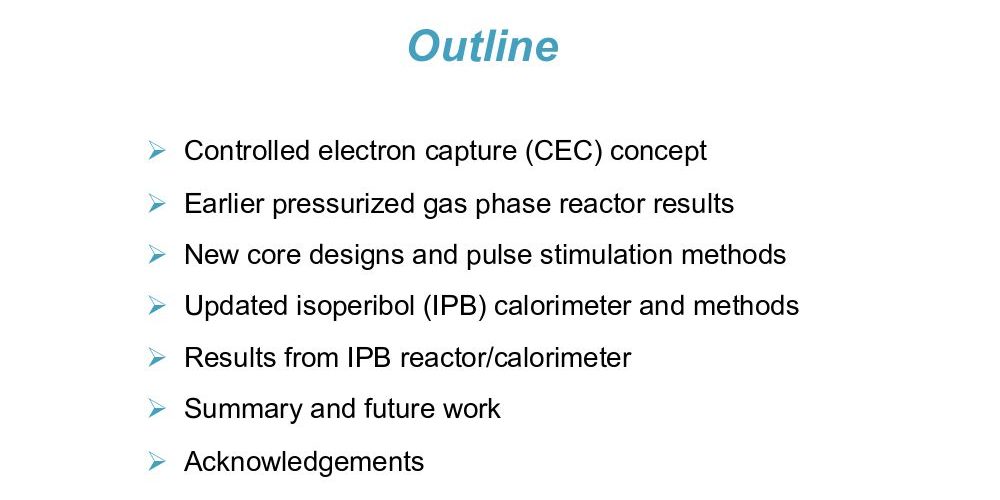
it is just a quick 00:26 outline, talk about some of the earlier 00:29 pressurized gas results, and the new 00:32 designs and calorimetry, and then give 00:36 you, hopefully, a taste of the results of 00:39 what we’re seeing so far, and, hopefully, a 00:42 little bit of idea what we’re trying to go 00:44 forward with.
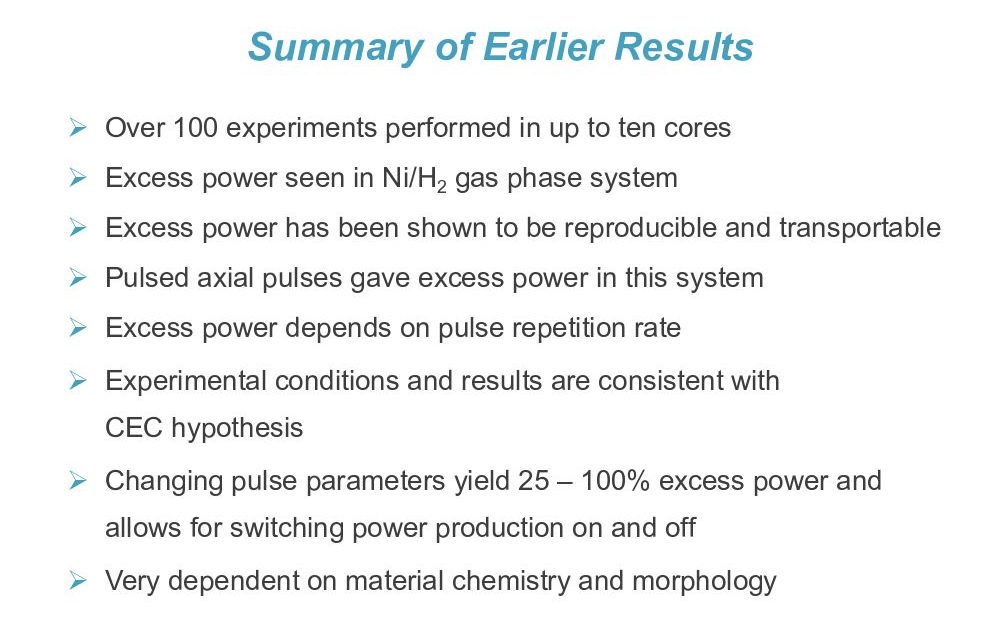
so, first a summary of 00:50 what’s happened before, up to about ICCF-20, 00:54 and that was about a hundred 00:56 experiments performed in ten cores,
[spacer height=”10px”]
and 00:59 I’ll explain to you what I mean by a 01:01 core.
[spacer height=”10px”]
and what we’ve been working, in the 01:05 nickel hydrogen system, at elevated 01:07 temperatures for over two years
[spacer height=”10px”]
so . . . 01:11 there’s enough excess power, and it was 01:13 reproducible enough, to convince us to 01:16 keep moving forward.
[spacer height=”10px”]
01:18 there are pulses sent through these 01:22 pieces of metal, and I’ll show you a 01:24 photo of a diagram in a minute, and 01:28 experimental results are consistent with 01:32 Robert Godes’s controlled electron 01:34 capture hypothesis, which I won’t go into 01:37 today just for brevity.
[spacer height=”10px”]
and by changing 01:42 the pulse parameters you can alter the 01:45 excess power by between twenty-five and 01:47 a hundred percent, and you can actually 01:50 turn it on and off, [while] putting in the 01:53 same amount of power by just changing 01:55 the parameters of the stimulation pulses.
[spacer height=”10px”]
01:58 you can turn it on and off.
[spacer height=”10px”]
Slide4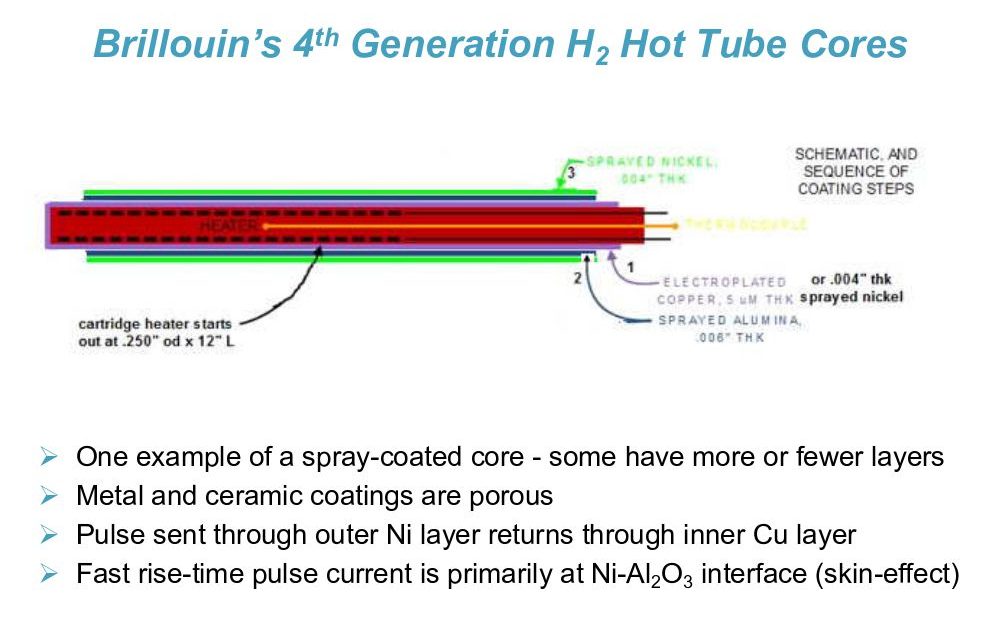
[spacer height=”10px”]
02:01 so this is more or less what one of them 02:05 looks like.
[spacer height=”10px”]
02:10 starting on the inside will either be a 02:12 metallic 02:13 or a ceramic tube, and sometimes there’s 02:17 a heater in the middle, but there’s 02:18 always a temperature sensor in the 02:20 middle.
[spacer height=”10px”]
on top of that, on the purple, is a 02:24 stripe of plasma sprayed copper, that’s 02:29 just a return line for the pulses,
[spacer height=”10px”]
and 02:31 then after that, which is actually dark 02:35 blue, but might be look black to you, is a 02:39 ceramic usually alumina, and that’s also 02:41 plasma sprayed, and then on top of that 02:43 is the nickel, 02:45 that’s plasma sprayed as well.
[spacer height=”10px”]
and those 02:49 numbers up there are approximate and 02:51 everything is porous, and the pulse is 02:55 sent between the nickel and the copper, 02:58 so it’s going through the dielectric.
[spacer height=”10px”]
and 03:02 these are fast rise time pulses and 03:05 they’re fast enough, 03:07 a few nanoseconds, that it induces the 03:11 skin effect, so most of the current is 03:13 within the first few microns of the 03:15 nickel, at the alumina interface.
[spacer height=”10px”]
Slide5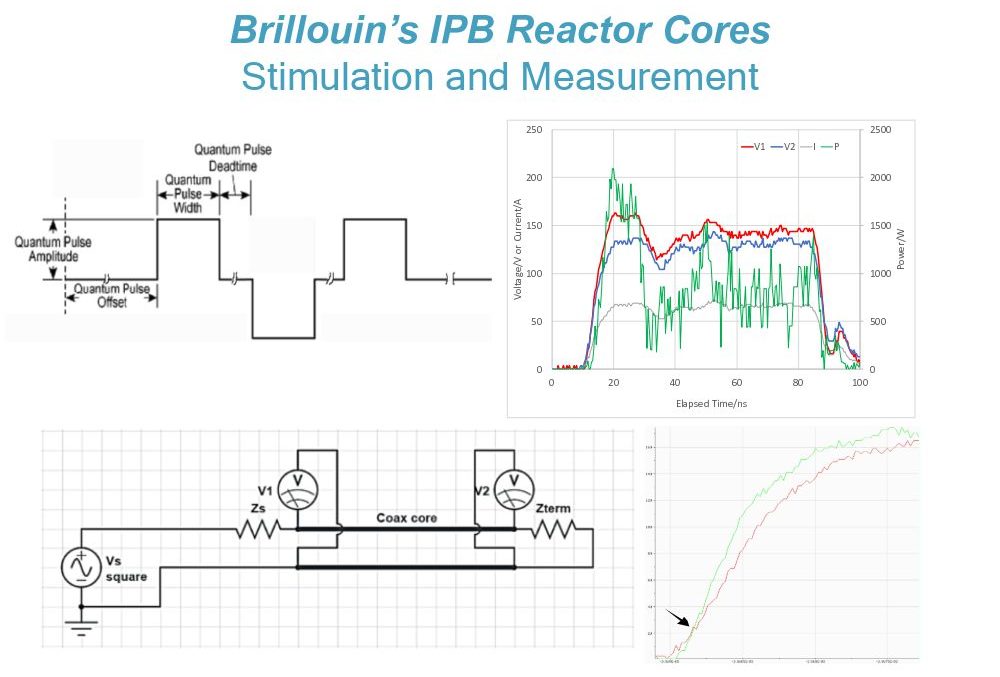
[spacer height=”10px”]
so 03:21 there’s an idea what the pulse looks 03:22 like.
[spacer height=”10px”]
we have a long dead time, 03:28 generally. the numbers are less than one 03:31 percent duty cycle.
[spacer height=”10px”]
they can be more 03:35 when we go to low voltages, so that we 03:38 keep everything constant.
[spacer height=”10px”]
the pulse 03:42 width can change, as [well as] the amplitude and 03:46 the dead time repetition rate.
[spacer height=”10px”]
this is 03:49 how we measure it. there’s a very nice 03:53 oscilloscope taking five million points 03:58 a second, no, five billion points a second.
[spacer height=”10px”]
04:01 anyway to give us — [we] want [it] to give us the 04:05 voltage at one end and then we get the 04:07 voltage at the other end, so in this 04:10 chart you see the voltages and the 04:14 current plotted on the left axis and the 04:16 power — instantaneous power — plotted on the 04:20 right axis.
[spacer height=”10px”]
so you measure v1 you measure 04:23 v2 that’s what they look like and red 04:25 and blue 04:27 v2 also gives you the current because 04:30 there’s a current shunt right up next to 04:32 that, into the core, and so that’s the 04:35 current down here in black, and then 04:36 multiply the difference of the voltages 04:38 times the current and you get this power 04:40 over here, this instantaneous power.
[spacer height=”10px”]
Slide6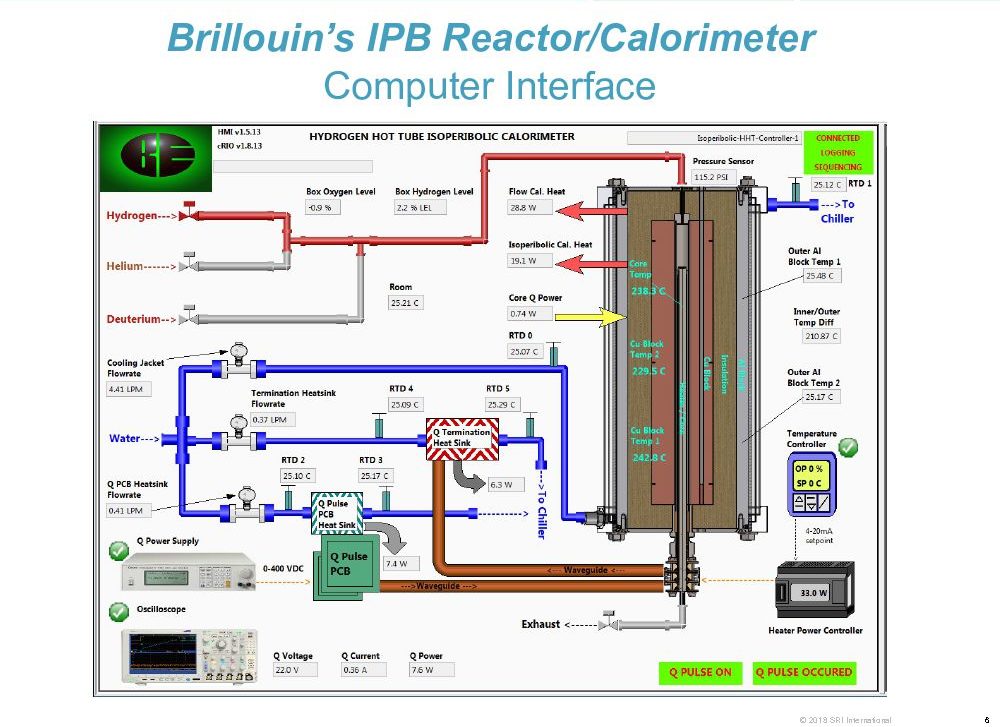
[spacer height=”10px”]
this 04:45 is what the interface looks like we 04:48 measure 57 parameters in the sequence 04:53 that we use
[spacer height=”10px”]
we use sequences to 04:56 automatically stimulate it.
[spacer height=”10px”]
some of 04:58 them run for a hundred hours and we just 05:00 take the data and analyze it, when it’s 05:02 ready. there’s some loss in the 05:07 termination resistor that’s designated 05:10 here, and in the switching transistor as 05:13 you can imagine that these currents — 05:16 you’re getting a lot of heat there.
[spacer height=”10px”]
05:19 those actually have water flow heat 05:21 sinks, so we’re doing some mass flow 05:23 calorimetry, on those two thermal losses.
[spacer height=”10px”]
05:27 I was going to show there there are 05:30 temperature sensors all over. there is one 05:32 in the middle there’s a couple (or 05:35 sometimes two) in the middle, two in the 05:37 heat spreader, another two out here in 05:41 the aluminum.
[spacer height=”10px”]
between the heat spreader 05:43 and an aluminum shell is a ceramic 05:46 insulation.
[spacer height=”10px”]
outside the aluminum shell is 05:49 an acrylic shell. and there’s water 05:51 flowing there to keep it at 25 degrees C.
[spacer height=”10px”]
Slide7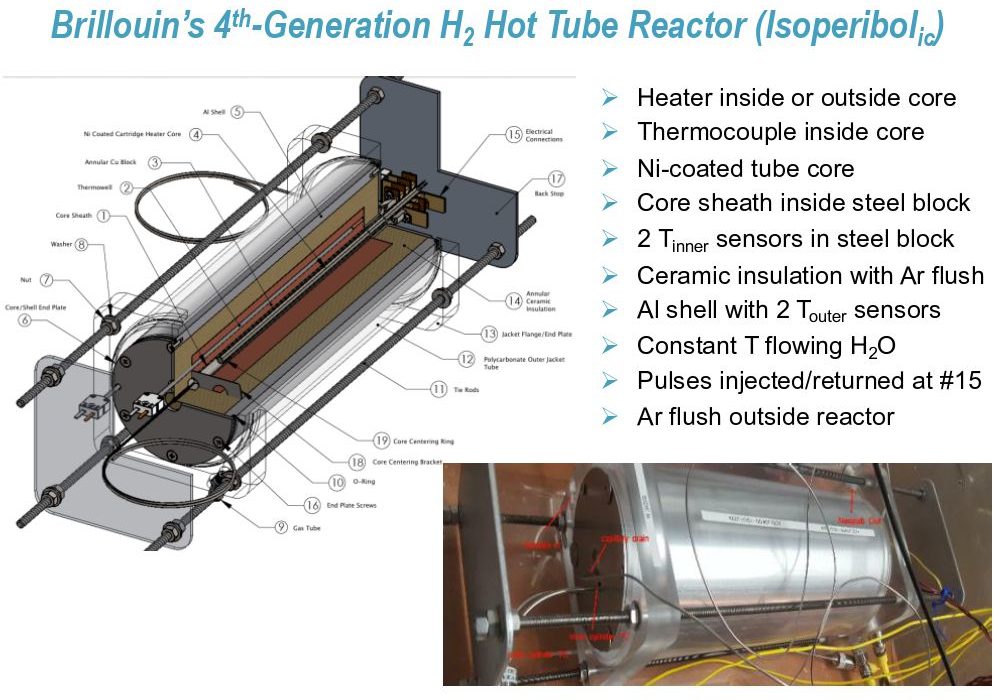
[spacer height=”10px”]
05:55 this is just another way of looking at 05:58 it, and I’ll point out, there’s a 06:00 feed through up here to send in and 06:03 return the pulses. everything else is 06:06 pretty much same.
[spacer height=”10px”]
there’s argon actually 06:09 flowing through that ceramic insulator 06:12 between the heat spreader and the 06:14 aluminum.
[spacer height=”10px”]
and there’s argon outside the 06:17 reactor just for safety purposes, since 06:19 we’re almost always using pure hydrogen 06:21 or pure deuterium.
[spacer height=”10px”]
Slide18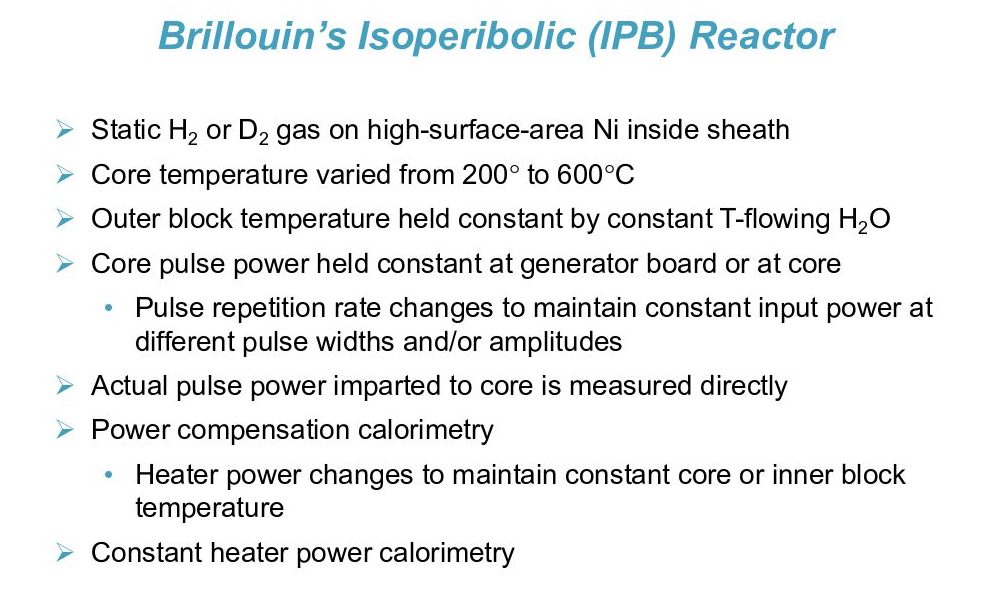
[spacer height=”10px”]
so, 06:27 static gas — we 06:30 keep it at a controlled pressure, top it 06:33 up as necessary, which is very rare, it’s 06:37 not flowing.
[spacer height=”10px”]
operation from 200 to 600 [C.] 06:41 and you saw the outer block is constant [temperature] 06:44 so that’s our isoperibolic 06:45 calorimeter.
[spacer height=”10px”]
the pulse power from the 06:50 stimulating pulse is held constant by 06:54 changing the amplitude, the repetition 06:58 rate, or the pulse width. actual pulse 07:04 power as measured, as I showed a couple 07:06 of slides ago, directly and in your two 07:09 types of calorimetry —
[spacer height=”10px”]
— power compensation 07:12 calorimetry, where the heater power is 07:16 set to [maintain] a constant temperature, and as you 07:19 add pulses to it, it lowers the power 07:22 going into the heater, and that 07:24 difference is part of our calorimetry.
[spacer height=”10px”]
— 07:26 and the other one is constant heater 07:29 power calorimetry, as you normally do, and 07:31 isoperibolic calorimetery, you keep 07:33 the heater power constant, and just 07:37 calibrate it at different heater power 07:39 steps, so you can calculate how much 07:42 power is being put in by the pulse. as it 07:46 adds on to the heater power.
[spacer height=”10px”]
Slide9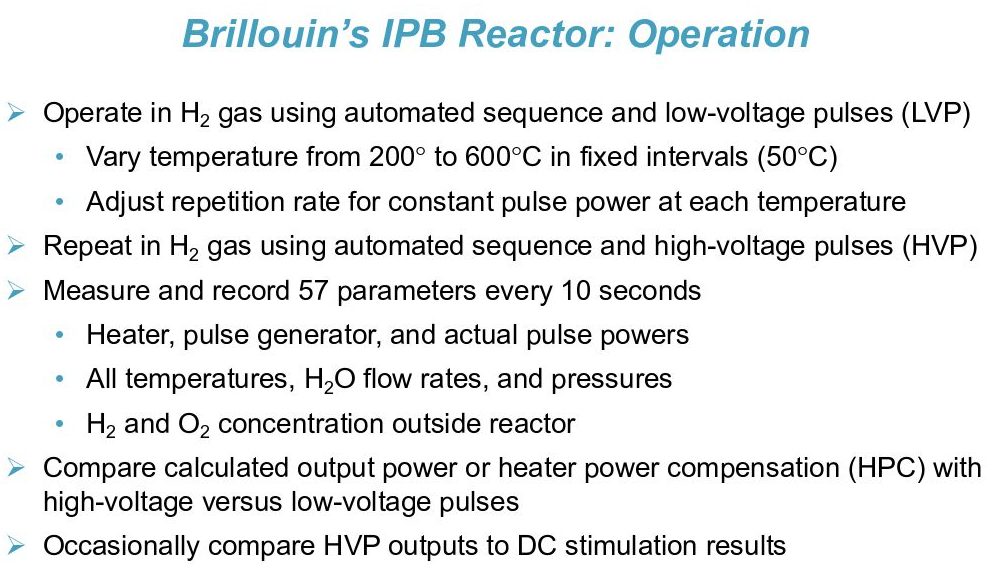
[spacer height=”10px”]
operation: 07:52 again I guess it was mostly an h2 gas 07:54 sometimes d2 we found we don’t need to 07:58 operate in argon or helium anymore.
[spacer height=”10px”]
it’s 08:00 just the all the thermal parameters are 08:04 so different it just gets too confusing, 08:06 so we just leave everything in hydrogen 08:10 most of the time.
[spacer height=”10px”]
again 200 [to] 600 C, adjust 08:15 everything, so first you do that pulse 08:19 stream with low voltage pulses.
[spacer height=”10px”]
the 08:22 concept in the hypothesis is that, below 08:26 a certain threshold, 08:27 you’re not going to induce this 08:29 controlled electron capture.
[spacer height=”10px”]
and so you 08:32 do that, you get your constant pulse 08:35 power, get all your parameters calculated, 08:38 calibrate your system, and then you go 08:40 and do the exact same thing, at the exact 08:42 same pressure and temperature with much 08:45 higher voltage pulses.
[spacer height=”10px”]
talking somewhere 08:48 about 30 volts versus 350 volts.
[spacer height=”10px”]
08:55 and you measure and record everything, 08:58 more than everything you need, every 10 09:02 seconds, including the hydrogen and 09:05 oxygen concentration outside the reactor 09:07 for safety reasons, and then you compare 09:10 that output power or heater power 09:14 compensation, depending on the method of 09:16 calorimetry, of high voltage pulses 09:19 versus low voltage pulses, everything 09:22 else held constant
[spacer height=”10px”]
the assumption is you 09:24 should have the exact same thermal 09:26 response.
[spacer height=”10px”]
and occasionally we’ll go in 09:30 there and do a DC calibration, just by 09:33 passing a DC current across the nickel, 09:35 without touching the copper or the 09:39 alumina.
[spacer height=”10px”]
Slide10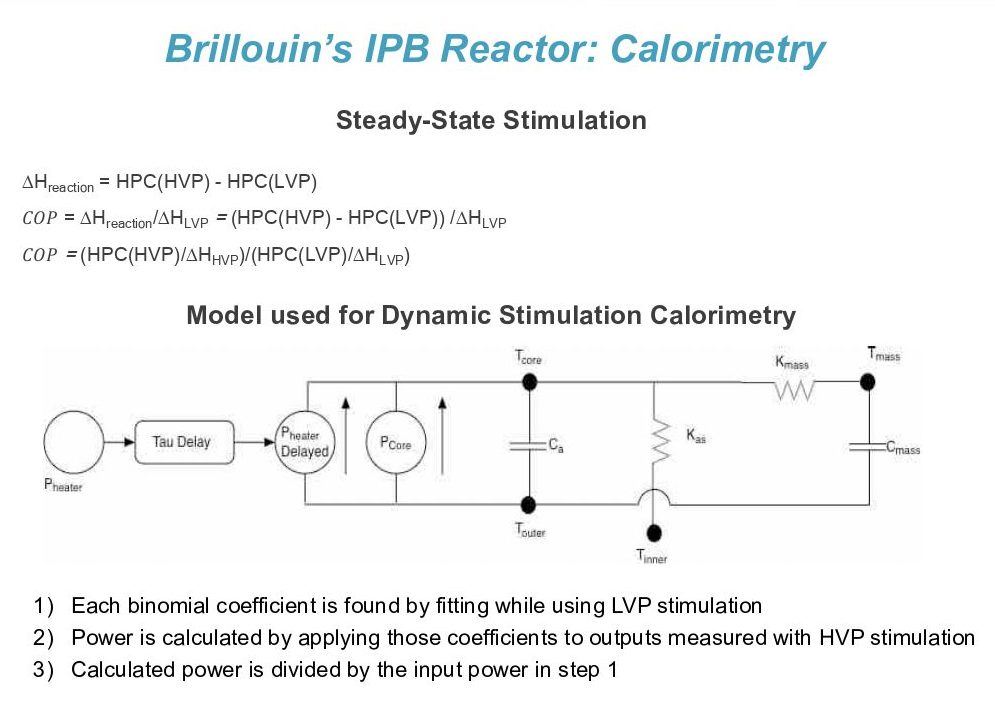
[spacer height=”10px”]
so . . . we have two methods of 09:46 calorimetry, we’ve been employing the 09:47 steady-state, [unintelligible] 09:51 the relatively well-established 09:55 method, or you just put in, increase the 09:59 heater power and wait, and pending on 10:01 your time constants, you can wait several 10:02 hours and call that your steady state, 10:05 temperature versus heater power.
[spacer height=”10px”]
and then 10:09 you do that with the pulses, and again 10:13 the high voltage versus low voltage and 10:16 that’s how you calculate Q.
[spacer height=”10px”]
10:21 delta H of reaction is just what you . . . the 10:25 heater power compensation, how much it’s 10:28 been reduced for a low voltage pulse, 10:30 compared to how much for a high voltage 10:32 pulse.
[spacer height=”10px”]
and then you could call — they like 10:37 to use COP, not everybody likes to use 10:39 it.
[spacer height=”10px”]
but then you just get your 10:41 delta H that you calculated, divided by 10:44 the amount of power that you know went 10:45 in, from your low voltage pulse 10:48 stimulation.
[spacer height=”10px”]
another method we use is 10:54 what I call dynamic stimulation.
[spacer height=”10px”]
and 10:56 in this you’re sending in essentially 11:00 half sine waves of combination of 11:06 both 11:07 the heater and the stimulation power.
[spacer height=”10px”]
11:10 they’re changing all the time, there’s nowhere 11:13 near steady-state, and you do that for 40 11:17 hours, or up to a hundred hours, depending 11:19 on the design.
[spacer height=”10px”]
and this gets you an idea 11:25 of what the model is.
[spacer height=”10px”]
11:27 as it turns out there are only four 11:30 terms that are important. that is 11:33 the K, which is the delta T between the 11:36 core and the heat spreader, and the other 11:40 K, which is between the core and the 11:44 outer temperature, and then there are two 11:49 heat capacity terms, and in front of 11:53 those are actually all three-parameter-binomials 11:57 and then you fit that in a 12:00 MATLAB program, under low voltage power, 12:02 and in reality maybe nine of those 12:06 twelve or eight of those twelve fall out 12:08 as zero, and you end up with four 12:11 parameters that you know define the 12:14 system.
[spacer height=”10px”]
and then you do that with the low 12:18 voltage stimulation, and then you apply 12:21 those same coefficients that you got 12:23 from the MATLAB, and in the low voltage 12:25 stimulation to your high voltage 12:26 stimulation.
[spacer height=”10px”]
and then just divide that 12:30 by the low voltage stimulation.
[spacer height=”10px”]
Slide11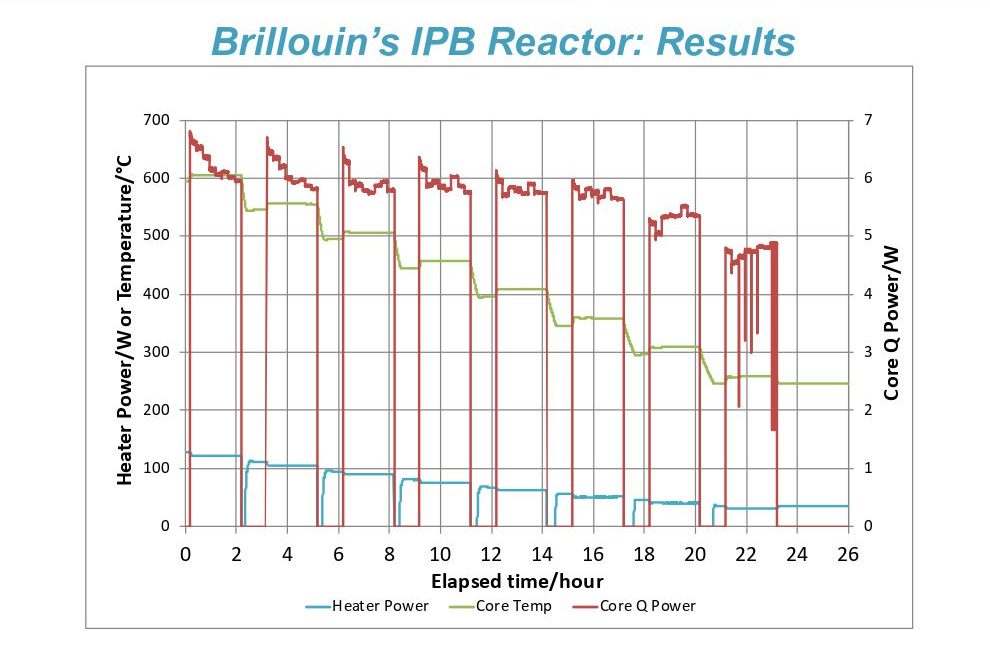
[spacer height=”10px”]
this 12:37 is just an idea of what the raw data 12:39 looks like. on the left axis is heater 12:43 power or temperature.
[spacer height=”10px”]
the heater 12:46 power is in blue, the temperature is in 12:49 green.
[spacer height=”10px”]
and then on the right axis is the 12:52 power, that’s measured by the 12:55 oscilloscope, going into the core.
[spacer height=”10px”]
and you 12:58 see that’s up to like six watts that 13:01 goes in.
[spacer height=”10px”]
Slide12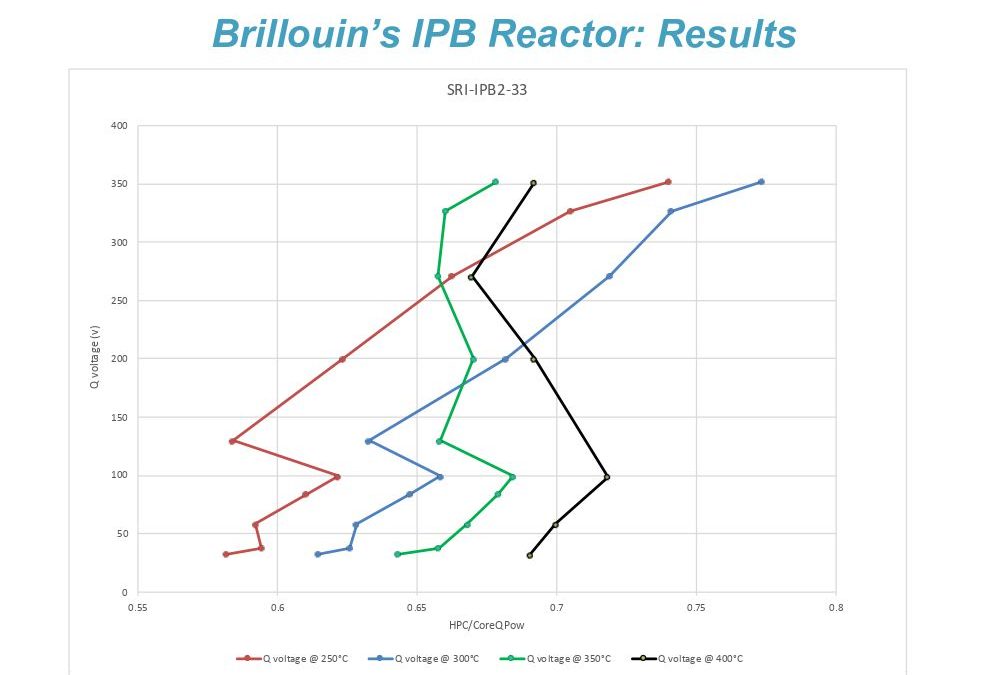
[spacer height=”10px”]
this is what some of the 13:07 steady-state results look like. so 13:09 instead of just doing it at two 13:11 different voltages we’ve done it in 13:13 several voltages.
[spacer height=”10px”]
so the y-axis, we’ve 13:17 plotted voltage of the pulse, 13:21 and the x-axis we’ve taken that heater 13:24 power compensation and divided it by the 13:27 power measured by the oscilloscope, and 13:30 so at, say, the green [red] line at 250 degree,s 13:34 down here about 35 volts, you get a ratio 13:38 of like 0.58.
[spacer height=”10px”]
but then you keep 13:42 increasing the voltage but maintaining 13:44 the exact same power going into the 13:47 system, and you see as you get up to 13:49 about 350 volts your way over here at 13:53 like 0.73 – 0.74.
[spacer height=”10px”]
so it’s not a great number, 13:58 but it’s a reproducible number, probably 14:00 25 percent, something like that.
[spacer height=”10px”]
and then 14:04 you see a very similar thing at 275 .. . 14:10 no at 300 [blue], and then when you get past 300 14:13 [green and black] interestingly, that ratio of the 14:17 heater power compensation is pretty much 14:21 the same at 350 volts as it is at 35 14:24 volts.
[spacer height=”10px”]
so it tells you that you’re not 14:28 creating excess power, and it also gives 14:30 you a built-in calibration that you know 14:33 what’s going on.
[spacer height=”10px”]
Slide13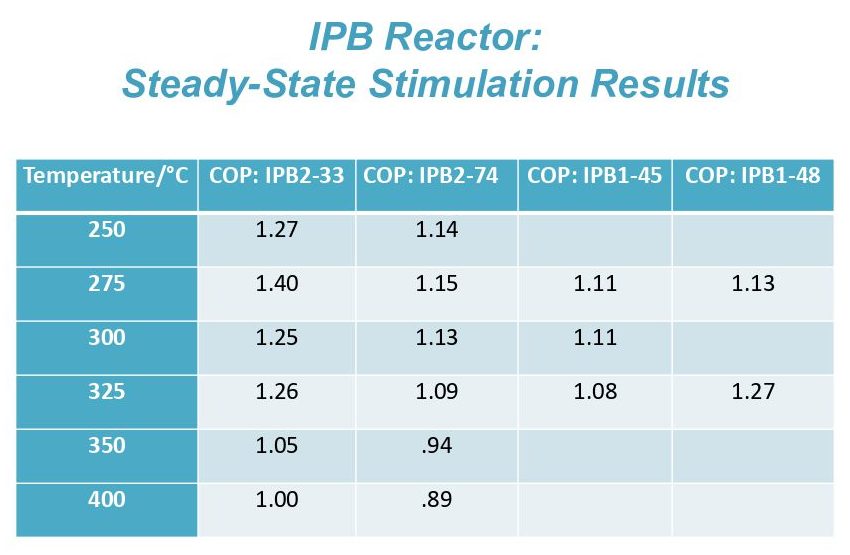
[spacer height=”10px”]
and this is some of the 14:38 summary from the from the steady-state 14:42 stimulation results and it’s very 14:45 similar to what you just saw if you stay 14:48 below 350 [C.] you get numbers, COP numbers 14:53 that are over one, above experimental 14:57 error.
[spacer height=”10px”]
and then 350 [C.] and up the numbers 15:01 are pretty much equal to experimental 15:04 error.
[spacer height=”10px”]
so you don’t see those at excess 15:07 power.
[spacer height=”10px”]
Slide14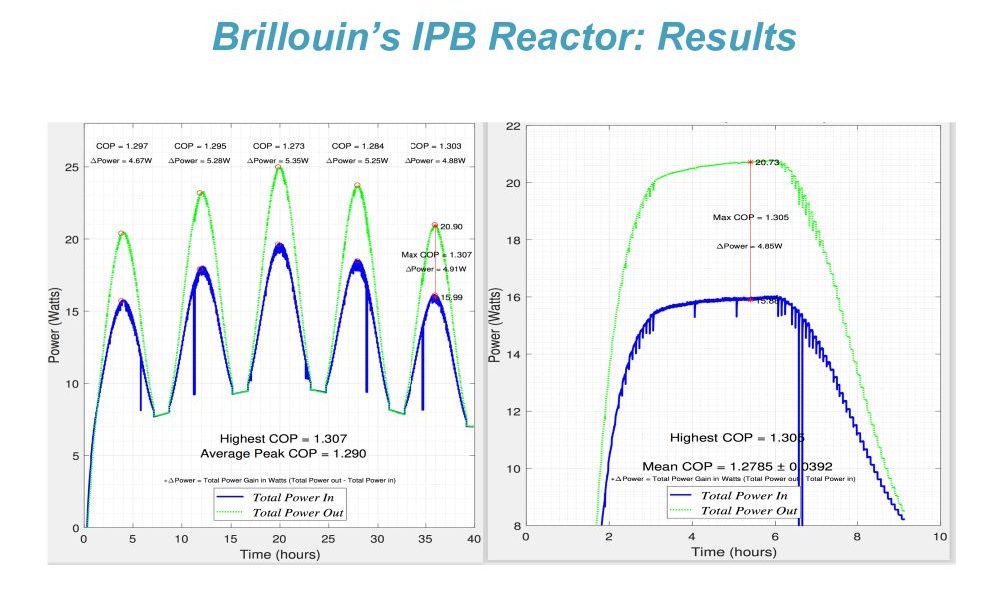
[spacer height=”10px”]
so this is what that pulse 15:14 stimulation looks like when we do the 15:17 dynamic stimulation, and this is a 15:19 combination of the heater and core power, 15:24 in blue, that was determined from the low 15:29 voltage pulses,
[spacer height=”10px”]
and then the delta 15:33 T, measured 15:35 in the high voltage pulses, had those 15:39 same coefficients determined from the 15:41 low voltage, applied to them, and that’s 15:44 the light green.
[spacer height=”10px”]
as you can see. there’s 15:48 no steady-state except I finally asked 15:52 them, why don’t you do something that 15:54 stands still for a while, so we can watch 15:57 it, instead of having to do all of this 15:59 computational stuff.
[spacer height=”10px”]
and so they held 16:03 this constant for about three hours and 16:06 as you can see the calculated power 16:10 output power, with the high voltage pulse, 16:12 is about five watts above what we got 16:16 with the low voltage pulse at the same 16:18 input power.
[spacer height=”10px”]
and, yes, those are similar 16:22 numbers over here, and you can see those 16:26 COPs are again — not overly exciting — but 16:30 between 1.2 and 1.3.
[spacer height=”10px”]
and over here. yeah. 16:36 same sort of number.
[spacer height=”10px”]
Slide15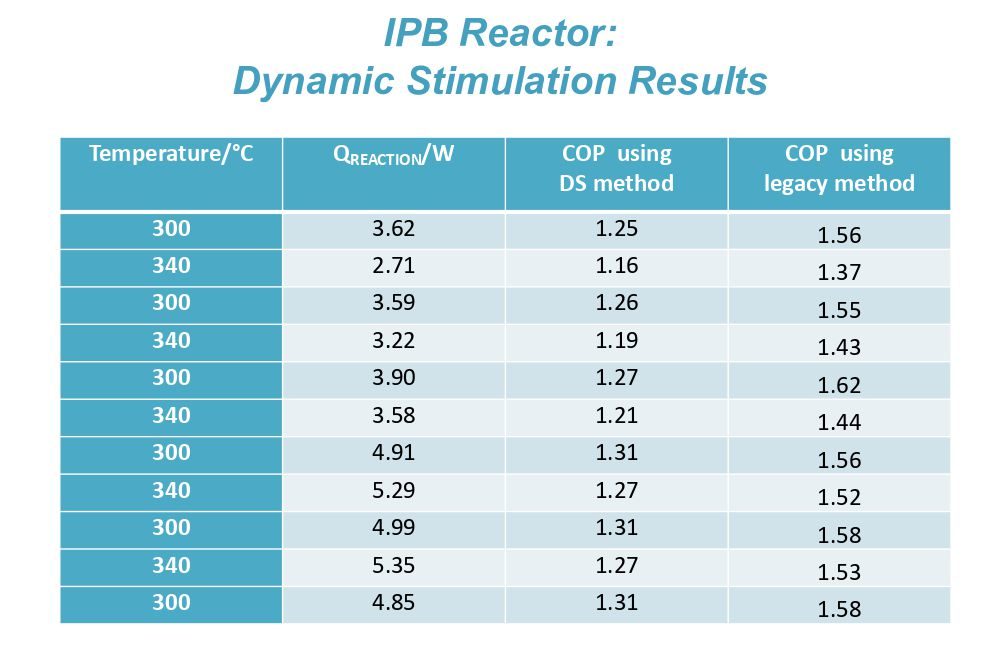
[spacer height=”10px”]
so we’ve done that a 16:40 bunch of times, and this is what some of 16:44 the dynamic stimulation results look 16:46 like, and again at different temperatures.
[spacer height=”10px”]
16:51 but none of these are above 350 [C.], so all 16:56 of them are showing some reasonable 17:00 powers, that delta H, as I said, the 17:04 difference between the low voltage pulse 17:07 and the high voltage pulse, up to 5 watts.
[spacer height=”10px”]
17:09 and then calculating the COP, using that 17:14 method again, those numbers in the 1.2 to 17:17 1.3 range.
[spacer height=”10px”]
but interestingly enough, when 17:22 we did all of that we changed the way we 17:25 did all of our calculations, compared to 17:27 what we reported earlier, and so I went 17:30 back and used the earlier method, 17:34 essentially put in a fudge factor, so we 17:36 could compare it to where we were 17:38 earlier, so that at least we could see 17:41 whether or not we were making progress.
[spacer height=”10px”]
17:43 and when you do that and progress was — we 17:47 were getting numbers 17:48 about the same, about one-point-two when 17:50 we used the old method, when when we went 17:53 back and reapplied that method to the 17:55 new data we got numbers closer to 1.5 — I 17:58 mean at 1.6.
[spacer height=”10px”]
which was important 18:01 to convince us that we needed — that we 18:04 were making progress, so we could go 18:05 forward.
[spacer height=”10px”]
Slide16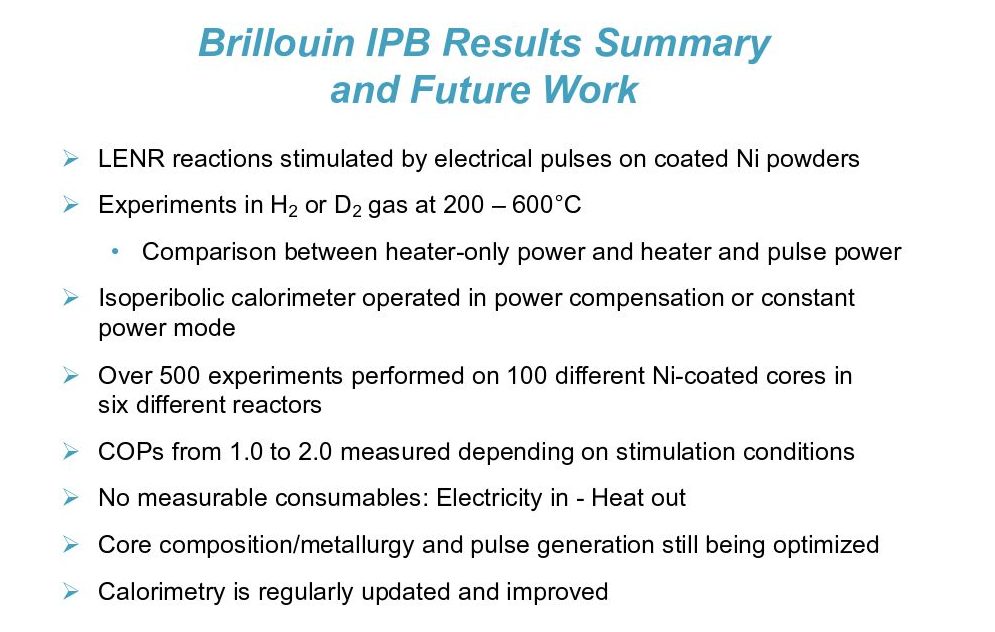
[spacer height=”10px”]
so let me sum up what we’ve 18:12 learned.
[spacer height=”10px”]
so these are reactions 18:14 stimulated by electrical pulses, very 18:17 narrow, very fast rise time, electrical 18:20 pulses on coated nickel powders, and these 18:23 are very porous nickel powders. 18:26 for experiments [we did?] hydrogen, deuterium 200 to 18:29 600 C., and heater-only power and heater 18:33 and pulse power, and in our compensation 18:37 mode, 500 experiments on a hundred 18:41 different nickel coated cores, and six 18:43 different reactors, so in the last two 18:45 years, we’ve upped our game, by an order 18:48 of magnitude with respect to the amount 18:51 of runs being made, and again, COP 18:54 between 1 & 2, electricity in, heat out.
[spacer height=”10px”]
19:00 and of course, as everybody else is still 19:03 doing, we’re still optimizing our metal 19:08 metallic composition and metallurgy, and 19:12 also since most of the group is 19:14 electrical engineers, they’re always 19:16 tweaking the pulse parameters, finding 19:18 narrower pulses, sharper rise time pulses, 19:21 and we regularly update and improve the 19:25 calorimetry.
[spacer height=”10px”]
Slide17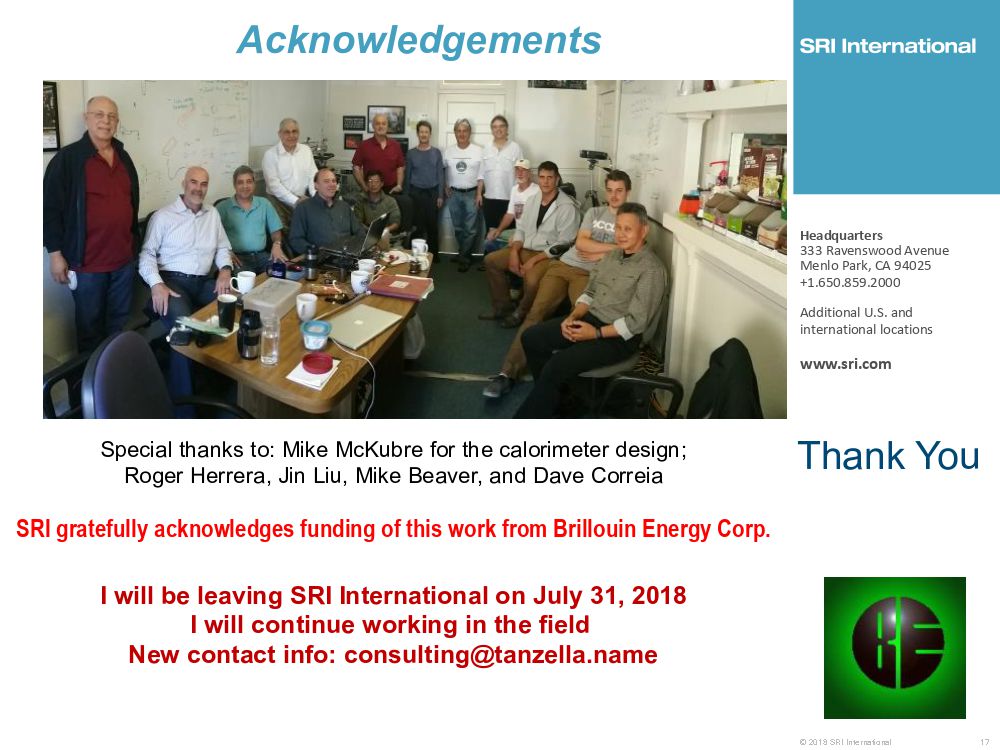
[spacer height=”10px”]
I need to acknowledge 19:29 Brillouin for their generous support at 19:32 SRI. this is an old picture of the group 19:36 in their conference room. they actually 19:38 have a lab.
[spacer height=”10px”]
about half of the experiments 19:40 are being run at SRI, half are being run 19:43 in their third-floor walk-up, as I refer 19:46 to it, in Berkeley which is behind that 19:49 rear door, and I want to thank you 19:54 for your attention.
[spacer height=”10px”]
but first one a note 19:57 a personal note on the bottom 20:00 for your information.
[spacer height=”10px”]
and thank you.
[spacer height=”10px”]
[Frank Gordon:] I 20:09 want to thank Fran because he’s helping 20:12 getting us back on time. we do have 20:14 time for some questions
[spacer height=”10px”]
[1st question:] got any numbers 20:23 for the impedance or the RC 20:28 frequencies from the aluminum oxide, is 20:31 there a capacitance there? 20:32 have you tried to match it?
[spacer height=”10px”]
yeah . 20:36 like I say, we’ve got a roomful of 20:38 electrical engineers and that’s what they they do 20:39 for a living. the number, the impedance is 20:42 in the 2 ohm range.
[spacer height=”10px”]
okay.
[spacer height=”10px”]
and they they’re 20:46 always measuring TDR, and minimizing 20:49 capacitance.
[spacer height=”10px”]
have you tried using 20:53 multiple layers and going through them.
[spacer height=”10px”]
20:55 we have done that but they weren’t very 20:59 successful, so they gave up on that since 21:01 that’s a lot harder to make.
[spacer height=”10px”]
[2nd questioner:] uh, Fran, 21:07 could you say something about the 21:08 material, the pressure, post-analysis 21:12 helium, anything like that?
[spacer height=”10px”]
okay we’re not 21:16 doing any post analysis. we do have, in 21:19 two of the six reactors we have 21:21 an online mass spec, but it’s it’s just 21:24 an RGA so it’s not telling us anything 21:27 too anomalous.
[spacer height=”10px”]
I’m sorry, I should have 21:30 mentioned: most of this is done between 21:32 eight and ten bar of hydrogen.
[spacer height=”10px”]
21:37 analysis: we’re not doing any gas 21:41 analysis. my mass spec is still being 21:43 tweaked, and occasionally they’ve tried 21:48 to get people to do isotopic analysis on 21:52 the powders, but nobody really seems to 21:55 be interested, or capable, of telling if 21:59 anything’s happening to the nickel.
[spacer height=”10px”]
I’m sure Francesco has a 22:04 quick answer or question, because it’s time 22:06 for an orientation
[spacer height=”10px”]
[Francesco Celani:] One, good paper. Second one, 22:11 we have long experience about 22:14 pulsing palladium [unintelligible] and we found that 22:19 the surface temperature is really larger 22:23 than of the bulk, because skin effect. do you 22:27 have an idea which one is your surface 22:30 temperature?
[spacer height=”10px”]
in the nickel?
[spacer height=”10px”]
oh yes 22:35 where you give pulse
[spacer height=”10px”]
22:38 well, because a nickel is paramagnetic, it 22:41 has the skin effect, so most of the 22:44 current is going at the interface.
[spacer height=”10px”]
okay
[spacer height=”10px”]
22:47 but this is just plasma sprayed, so it’s 22:51 very random, there’s no controlled 22:54 morphology, or anything.
[spacer height=”10px”]
okay. thank you.
[spacer height=”10px”]
Slides not shown: Slide18 was blank.
[spacer height=”10px”]
Slide19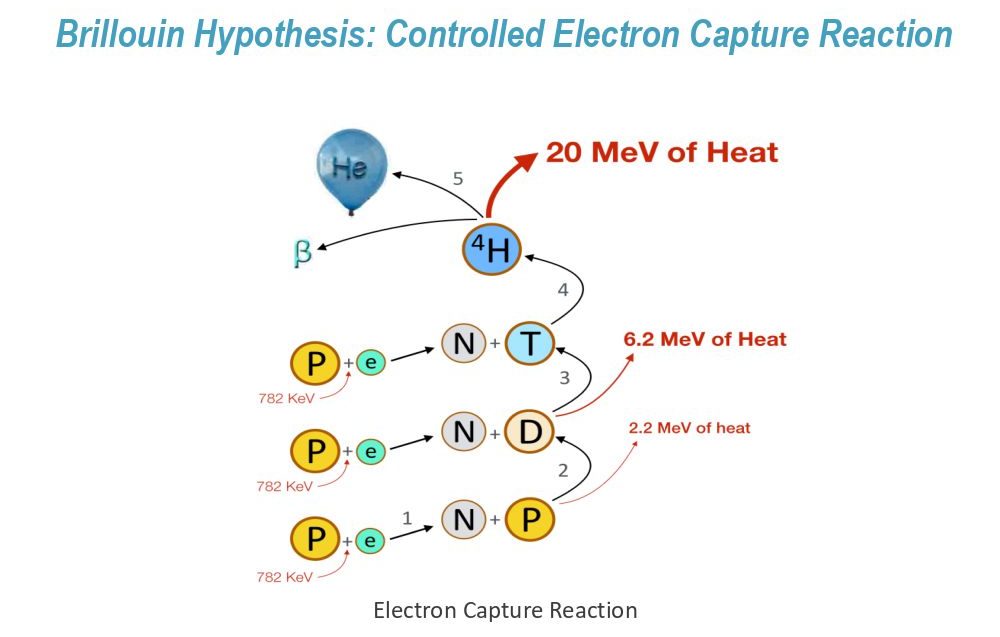
[spacer height=”10px”]
List of slides and slide text
[spacer height=”10px”]
Slide1
Nanosecond Pulse Stimulation in the Ni-H2 System
Francis Tanzella, Robert Godes, Robert George
Presented at ICCF21 / Ft. Collins, CO USA / June 5, 2018
Brillouin Energy Corp.
Slide2
Outline
Ø Controlled electron capture (CEC) concept
Ø Earlier pressurized gas phase reactor results
Ø New core designs and pulse stimulation methods
Ø Updated isoperibol (IPB) calorimeter and methods
Ø Results from IPB reactor/calorimeter
Ø Summary and future work
Ø Acknowledgements
Slide3
Summary of Earlier Results
Ø Over 100 experiments performed in up to ten cores
Ø Excess power seen in Ni/H2 gas phase system
Ø Excess power has been shown to be reproducible and transportable
Ø Pulsed axial pulses gave excess power in this system
Ø Excess power depends on pulse repetition rate
Ø Experimental conditions and results are consistent with CEC hypothesis
Ø Changing pulse parameters yield 25 – 100% excess power and allows for switching power production on and off
Ø Very dependent on material chemistry and morphology
Slide4
Brillouin’s 4th Generation H2 Hot Tube Cores
One example of a spray-coated core – some have more or fewer layers
Ø Metal and ceramic coatings are porous
Ø Pulse sent through outer Ni layer returns through inner Cu layer
Ø Fast rise-time pulse current is primarily at Ni-Al2O3 interface (skin-effect)
Slide5
Brillouin’s IPB Reactor Cores / Stimulation and Measurement
Slide6
Brillouin’s IPB Reactor/Calorimeter / Computer Interface
Slide7
Brillouin’s 4th-Generation H2 Hot Tube Reactor (Isoperibolic)
Ø Heater inside or outside core
Ø Thermocouple inside core
Ø Ni-coated tube core
Ø Core sheath inside steel block
Ø 2 Tinner sensors in steel block
Ø Ceramic insulation with Ar flush
Ø Al shell with 2 Touter sensors
Ø Constant T flowing H2O
Ø Pulses injected/returned at #15
Ø Ar flush outside reactor
Slide8
Brillouin’s Isoperibolic (IPB) Reactor
Ø Static H2 or D2 gas on high-surface-area Ni inside sheath
Ø Core temperature varied from 200° to 600°C
Ø Outer block temperature held constant by constant T-flowing H2O
Ø Core pulse power held constant at generator board or at core
• (Pulse repetition rate changes to maintain constant input power at
different pulse widths and/or amplitudes)
Ø Actual pulse power imparted to core is measured directly
Ø Power compensation calorimetry
• (Heater power changes to maintain constant core or inner block
temperature)
Ø Constant heater power calorimetry
Slide9
Brillouin’s IPB Reactor: Operation
Ø Operate in H2 gas using automated sequence and low-voltage pulses (LVP)
• Vary temperature from 200° to 600°C in fixed intervals (50°C)
• Adjust repetition rate for constant pulse power at each temperature
Ø Repeat in H2 gas using automated sequence and high-voltage pulses (HVP)
Ø Measure and record 57 parameters every 10 seconds
• Heater, pulse generator, and actual pulse powers
• All temperatures, H2O flow rates, and pressures
• H2 and O2 concentration outside reactor
Ø Compare calculated output power or heater power compensation (HPC) with
high-voltage versus low-voltage pulses
Ø Occasionally compare HVP outputs to DC stimulation results
Slide10
Brillouin’s IPB Reactor: Calorimetry
Steady-State Stimulation
ΔHreaction = HPC(HVP) – HPC(LVP)
COP = ΔHreaction/ΔHLVP = (HPC(HVP) – HPC(LVP)) /ΔHLVP
COP = (HPC(HVP)/ΔHHVP)/(HPC(LVP)/ΔHLVP)
Model used for Dynamic Stimulation Calorimetry
Slide11
Brillouin’s IPB Reactor: Results
Heater / Core Power / Temperature vs Elapsed time
Slide12
Brillouin’s IPB Reactor: Results
Voltage vs Power at 4 temperatures for Core IPB2-33
Slide13
IPB Reactor: Steady-State Stimulation Results
COP for 4 cores at 250° – 400°C
Slide14
Brillouin’s IPB Reactor: Results
Power v. Time
Slide15
IPB Reactor: Dynamic Stimulation Results
Qreaction with COP, two methods
Slide16
Brillouin IPB Results Summary and Future Work
Ø LENR reactions stimulated by electrical pulses on coated Ni powders
Ø Experiments in H2 or D2 gas at 200 – 600°C
• Comparison between heater-only power and heater and pulse power
Ø Isoperibolic calorimeter operated in power compensation or constant
power mode
Ø Over 500 experiments performed on 100 different Ni-coated cores in
six different reactors
Ø COPs from 1.0 to 2.0 measured depending on stimulation conditions
Ø No measurable consumables: Electricity in – Heat out
Ø Core composition/metallurgy and pulse generation still being optimized
Ø Calorimetry is regularly updated and improved
Slide17
Acknowledgements
SRI International, Headquarters: 333 Ravenswood Avenue, Menlo Park, CA 94025
+1.650.859.2000. Additional U.S. and international locations www.sri.com
Special thanks to: Mike McKubre for the calorimeter design; Roger Herrera, Jin Liu, Mike Beaver, and Dave Correia
SRI gratefully acknowledges funding of this work from Brillouin Energy Corp.
I will be leaving SRI International on July 31, 2018. I will continue working in the field
New contact info: consulting@tanzella.name
Slide18 blank
Slide19
Brillouin Hypothesis: Controlled Electron Capture Reaction

